Sampling
- It is a technique in which a random sample is drawn and on the basis of this random sample the decision of acceptance and rejection is taken.
- 100% inspection.
- Sampling inspection.
- It is generally expensive.
- Handling by inspector can induce defect.
- Can not used when the product destroy while inspection.
- Sampling involve some risk : good lot is rejected that is producer risk ,bad lot is accepted that is consumer risk


- It is an important field of statistical quality control.
- It is popularized by Dodge and Roming.
- Originally applied by US military for testing of bullets in world war 2.
- It is also known as "the middle of the road".
- Counted using binomial.
- It is based on go and no go gauge.
- If the lot is having too many defective the lot is rejected otherwise accepted.
- It is also known as continuous measurement.
- Usually measured by using mean and standard deviation.
- The most important element of acceptance sampling is choosing an appropriate sampling plan which specify lot size and number of sample, size of each sample ,rule /criteria of acceptance and rejection.
- Single sampling plan.
- Double sampling plan.
- Multiple sampling plan or sequential sampling plan
- When the decision of acceptance and rejection of the lot is based on only one sample then it is known as single sampling plan.
- Flowchart for single sampling plan


- When the decision of acceptance or rejection of lot may be based on two sample then it is known as double sampling plan.

- Flow chart for double sampling plan.


- The percentage of defect of the lot at which the consumer are willing to accept the lot as good.
- Example no electricity for 15 minutes in a day, Newspaper not delivered five times in a year.
LTPD:lot tolerance percentage defective
LQL: Limiting quality level.
UQL: unacceptable quality level.
- The upper limit on the percentage of defect of the lot at which the consumer is willing to accept the lot.
- It represent the probability that the lot containing the acceptable quality level will be rejected.
- Good lot is rejected.
- It is denoted by alpha.
- It is also known as type 1 error.
- It is 5% common.
- It represent the probability that the lot containing the defect exceeding RQL/LTPD/LQL/UQL will be accepted .
- Bad lot is accepted.
- It is denoted by beta.
- It is known as type 2 error. It is 10% common.
- It is a graph between percentage defective or fraction defective in the incoming lot and the probability that the sampling plan will accept the lot.
- It is used to measure the performance of sampling plan.
- It can apply for all three types of sampling plan.
- Pa is the probability of acceptance
- % p = percentage defective

- As the % defective increase the probability of acceptance will decrease.
- At lower percentage defective the probability of acceptance is higher and at higher percentage defective the probability of acceptance is low.


IQL: Indifference quality level
- The percentage of defective in the lot at which the probability of acceptance is 50%.
1.alpha=5% , at AQL = 0.02
- It means we consider it that 2% defective lot is to be good and we preferred to reject such batch not more than 5% of time.
- It means we consider it that 8% defective lot are poor and we prefer to accept these batch or such batch not more than 10% of time.


Effect of sample size on OC curve keeping acceptance number constant

Question : the maximum % defect that a consumer may find definitely acceptable?
Answer : LTPD
AOQ
- It represent the average % defective in the outgoing product after inspection including all accepted and all rejected.
- It is the another method to evaluate the goodness of sampling plan .


AOQL
- Average outgoing quality level
- The maximum value of average outgoing quality is known as AOQl
- (AOQ)max = AOQL
Note : AOQL value and the shape of AOQ curve depend on particular sampling plan . sampling plan are design such that there AOQL does not exceed a certain specific value.
Question : if the probablity of acceptance of 1 % defective lot is 0.95 then what is value of AOQ?

Question : in an acceptance sampling plan develop for lot containing 1000 unit the sample size is 85 and acceptance number is 3 . The % defective of incoming lot is 2 % and the probablity of acceptance which is obtain from OC curve is 0.64 . What is value of AOQ?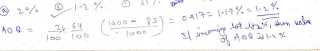

Question : OC curve for 100 % inspection is :

Answer : ii

0 Comments